If you’re using RubyLLM in production (or planning to), you’re probably already enjoying its elegant interface for conversation management: tool calls, chat contexts and messages handled neatly. But what happens when you need to debug a latency issue, audit what the model said, track token costs, or even investigate which tool calls led to certain responses across thousands of conversations?
The observability gap for LLM calls
Inspecting your database isn’t a great way to audit your LLM calls. You can see that a tool was called, however, there is context that is lost. When in the conversation flow was the tool called? How long did it take? How did this connect to the final response? It doesn’t provide a decent visualization, it’s easy to overlook patterns, and, frankly, it’s just not built for that.
We learned this firsthand while building an AI-powered chat for a healthcare client. The application uses LLM calls to help customers find product information, and we needed to know:
- How long are these calls taking?
- Are the responses accurate?
- What’s the token cost per conversation?
- Are the right tools being called at the right time?
- Where are the bottlenecks for latency?
What you really want is structured, real-time observability - the same kind you’d expect for any other critical part of your application, especially if you operate in regulated industries where you need audit trails and visibility into AI behavior. That’s where OpenTelemetry comes in.
OpenTelemetry instrumentation for RubyLLM
OpenTelemetry is the industry standard for vendor-agnostic observability. You can export telemetry data to whatever backend you already use, or platforms built specifically for LLM tracing:
We recently released OpenTelemetry RubyLLM Instrumentation, a gem that automatically captures traces for RubyLLM following the OpenTelemetry GenAI semantic conventions. It’s listed on the OpenTelemetry Registry and part of the official RubyLLM ecosystem.
Setup and use
Add the OpenTelemetry gems to your Gemfile and the RubyLLM instrumentation and run bundle install:
gem "opentelemetry-sdk"
gem "opentelemetry-exporter-otlp"
gem "opentelemetry-instrumentation-ruby_llm"
Create an initializer for OpenTelemetry:
# config/opentelemetry.rb

ENV["OTEL_TRACES_EXPORTER"] ||= "console"

OpenTelemetry::SDK.configure do |c|
  c.use "OpenTelemetry::Instrumentation::RubyLLM"
end
You don’t wrap your LLM calls in tracing blocks. You don’t pass trace names, record token usage, or wire up tool call callbacks. Instead, you configure the gem once and every chat completion, tool call, and token count is traced automatically. That’s enough to see your traces coming through the console as you use RubyLLM.
If you want to consume your traces in Langfuse, for example, you can configure the exporter to send them to your Langfuse project:
# config/opentelemetry.rb

credentials = Base64.strict_encode64("#{ENV['LANGFUSE_PUBLIC_KEY']}:#{ENV['LANGFUSE_SECRET_KEY']}")

OpenTelemetry::SDK.configure do |c|
  c.service_name = "ruby_llm-demo"
  c.add_span_processor(
    OpenTelemetry::SDK::Trace::Export::BatchSpanProcessor.new(
      OpenTelemetry::Exporter::OTLP::Exporter.new(
        endpoint: "https://us.cloud.langfuse.com/api/public/otel/v1/traces",
        headers: { "Authorization" => "Basic #{credentials}" }
      )
    )
  )
  c.use "OpenTelemetry::Instrumentation::RubyLLM"
end
The pattern is similar for other backends.
📝 By default, message content is not captured. Read the gem’s README to learn how to enable it. Captured content may include sensitive or personally identifiable information (PII). Use with caution in production environments. We recommend using Top Secret to filter sensitive information.
Here’s an example of what a trace looks like in Langfuse after an installation configured to capture content:
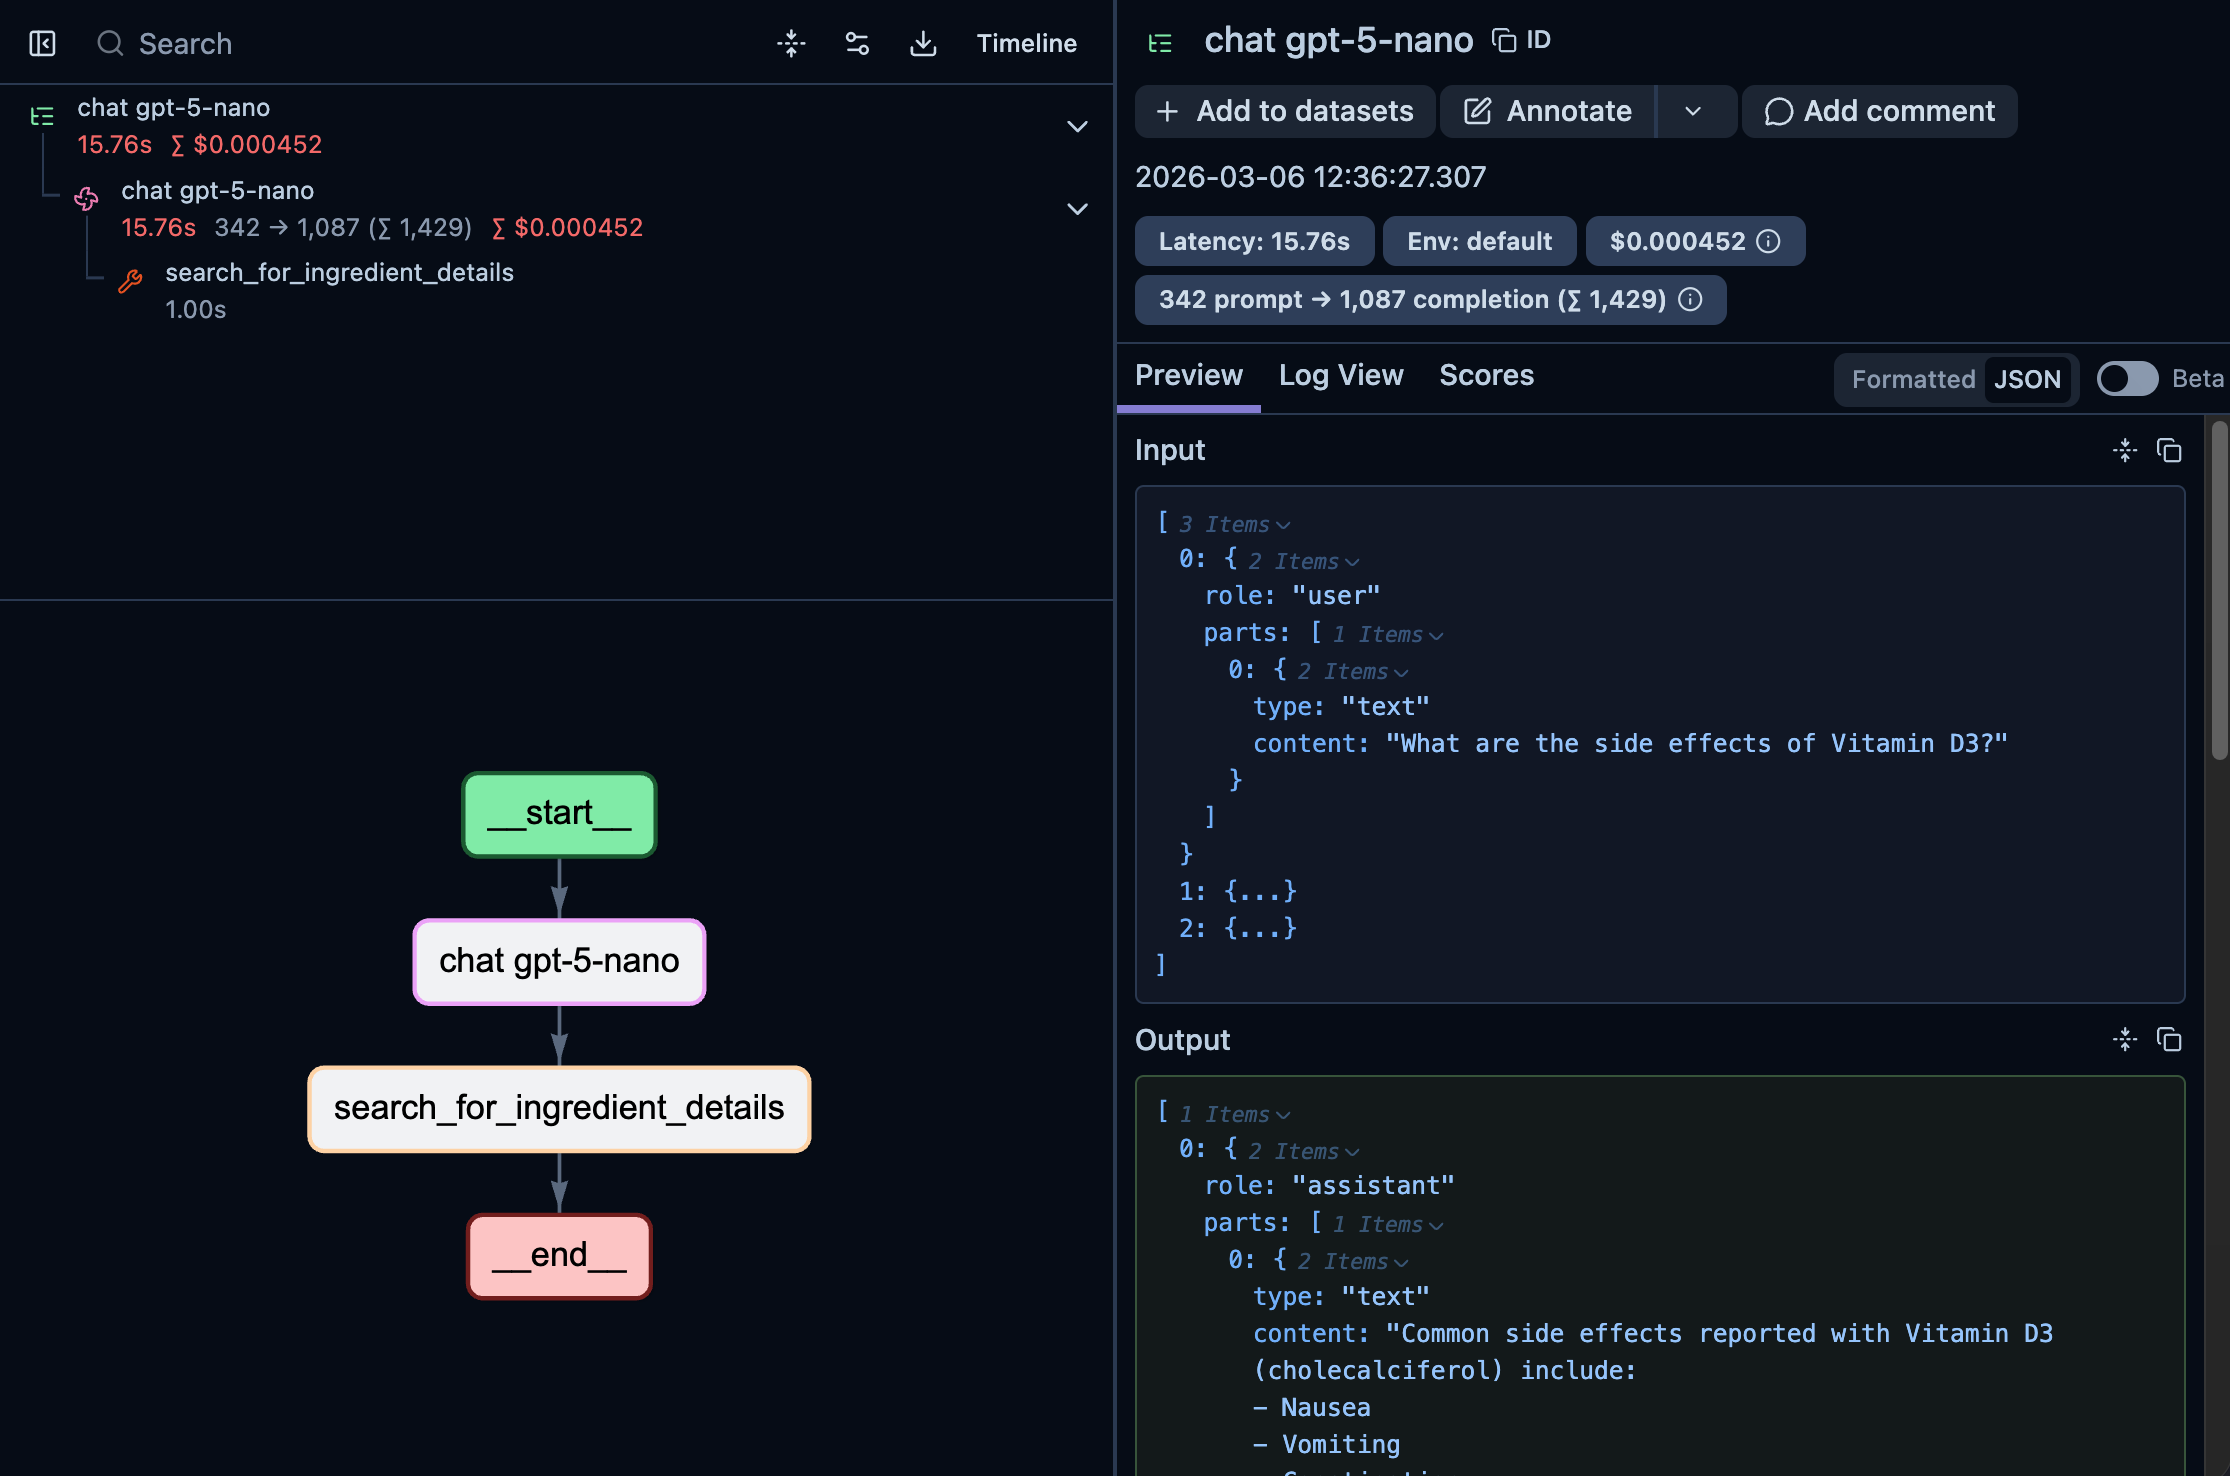
At a glance, you can see the full trace took 15.76s and cost $0.000452, immediately useful for cost monitoring.
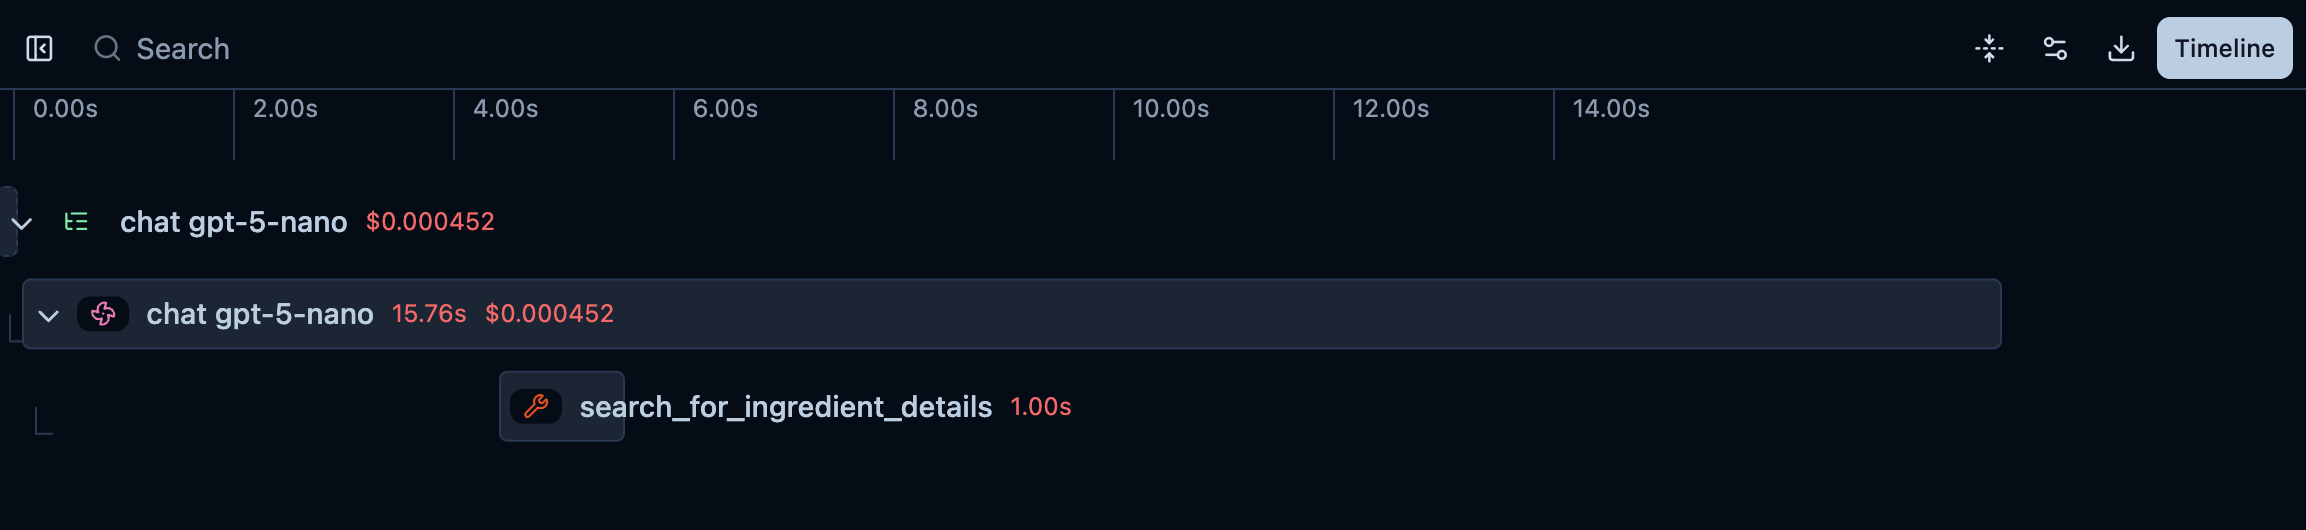
Clicking “Timeline” reveals exactly when the tool call happened and where the latency lives:
If you click on the search_for_ingredient_details span, you’ll see the details for the tool call: the query that the LLM used on the tool call and the output of it:
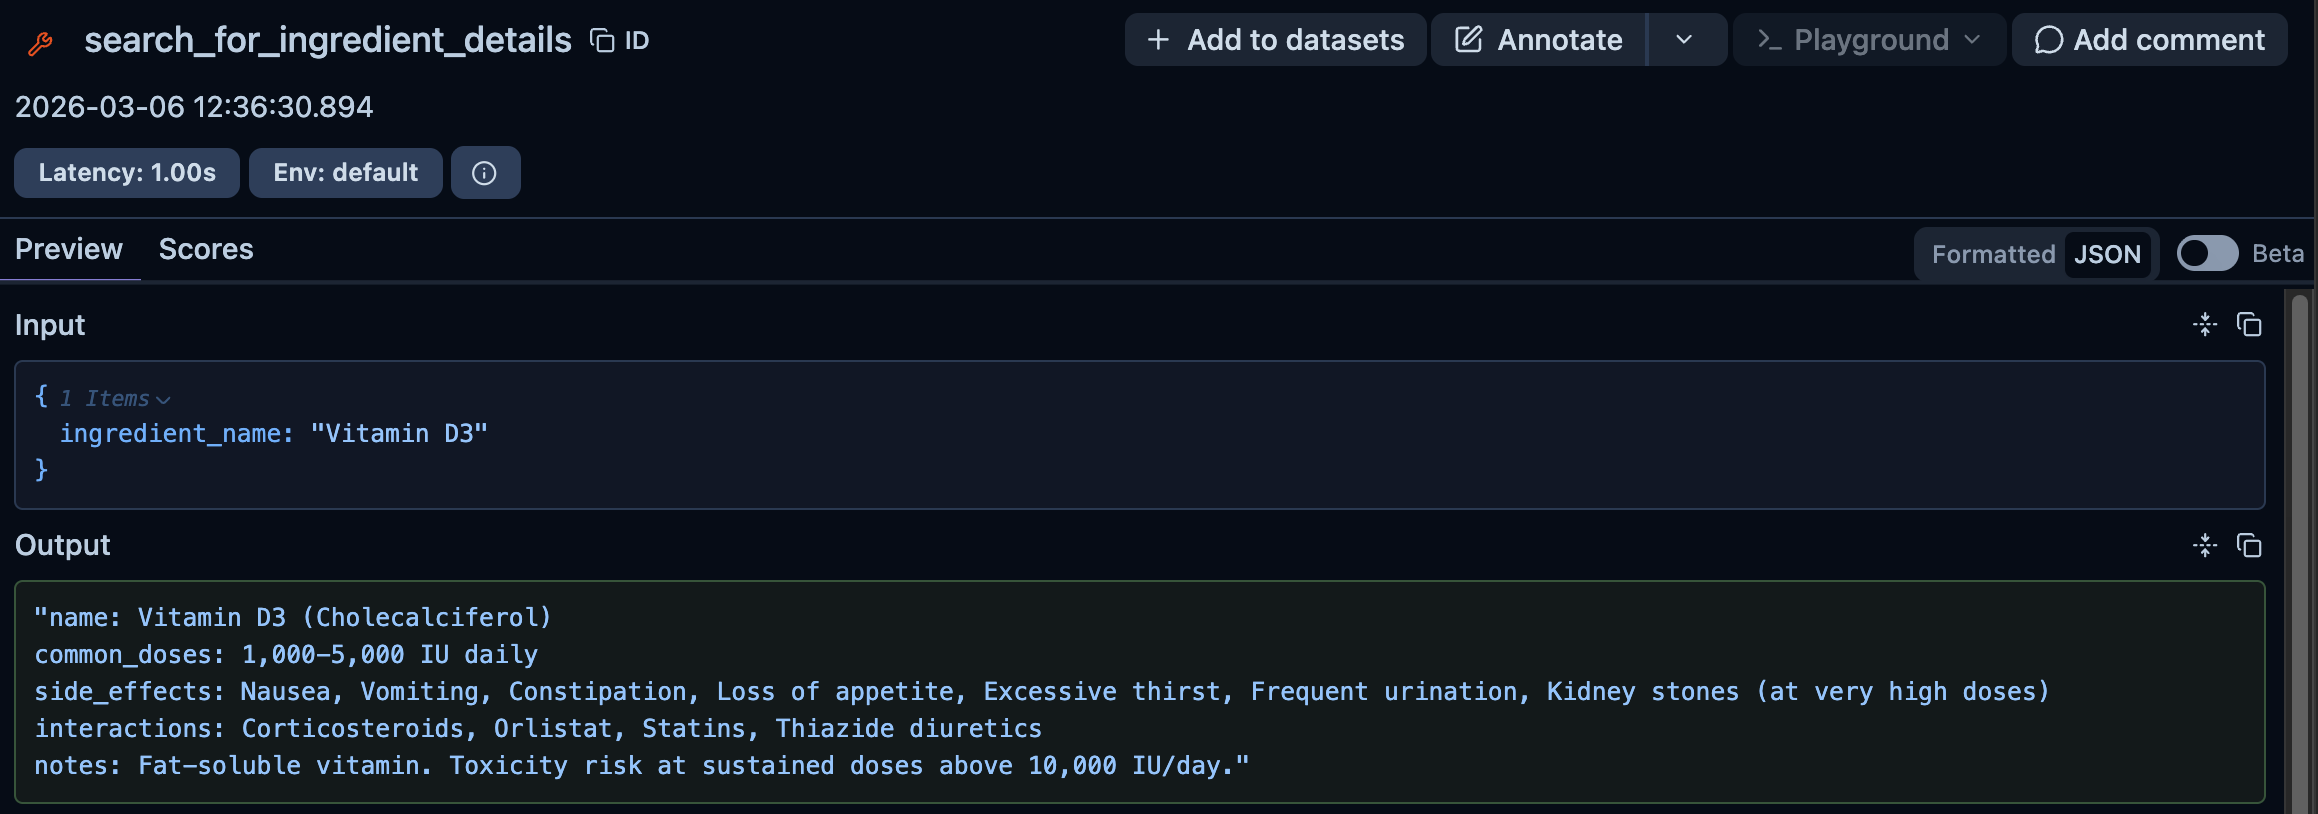
If the tool call itself had called another LLM, you’d also be able to see that nested under the same trace.
For regulated environments, these traces give you a complete audit trail of every LLM interaction: what was asked, what tools were called and what was returned.
What’s next?
The gem is on active development and getting more features to instrument all LLM operations that RubyLLM supports, end-to-end. We’re also keen to develop more instrumentation libraries for other LLM gems we love, like ActiveAgent and langchain.rb, so stay tuned for more.
Need help adding observability to your AI-powered application? Our team has hands-on experience building and monitoring LLM systems in production. Get in touch to discuss your project.