The Platform Engineering team attended the AWS Summit Virtual EMEA last week. The AWS Summits are free and happen all over the world. We highly recommend attending one in your local area to learn the latest on AWS services, best practices, and networking.
All sessions from the virtual event are available online ondemand if you register at the link above. Talk tracks range from highly technical to business level, there is something for everyone!
The Platform Engineering team is sharing highlights from the following three sessions:
- improve application availability and performance with observability services
- data protection in AWS
- design patterns to increase the availability of your online applications
Improve application availability and performance with observability services
When you are instrumenting your application for metrics, you can classify metrics by
- System level metrics - API requests count, latency, Error count, CPU utilization etc.
- Business level metrics - Revenue, Sign-ups , Product purchased, etc
- Operational metrics - CI/CD pipeline metrics, MTTR metrics, number of on call pages, etc
Collecting Metrics
Four different options for collecting metrics were presented:
- Cloudwatch built in metrics - provides metrics from AWS services such as EC2 and Lambda.
- Cloudwatch Agent - Can be installed on your on-premise servers and can export system level metrics to AWS CloudWatch from servers that are running outside AWS.
- Cloudwatch SDK - collect custom metrics from your applications. You can use this in your application code to collect metrics from a Ruby or Javascript code and feed it into AWS Cloudwatch for monitoring. a. Cloudwatch Ruby SDK b. Cloudwatch JS SDK
- Opensource tools - You can instrument your application to collect metrics using open source instrumentation tools such as Prometheus servers, Grafana cloud agent, OpenTelemetry. These metrics can be pushed to Amazon Managed service for Prometheus and Amazon managed service for Grafana where they can be reviewed and analysed.
Instrumenting your application for Logs
Built-in logs in AWS
- API gateway has some default logging provided out of the box;
- AWS Lambda: AWS Lambda is also configured to ship logs to CloudWatch
Container instance logging
You can use a Cloudwatch agent to collect logs from your containers. You can also use Firelens(with AWS for Fluent Bit and FluentD) to ship logs to AWS services and other third party services.
Logging for EKS (EC2 launch type)
- Control plane logging is enabled by default by shipping logs to Cloudwatch
- Node logging / Application logging - you can ship logs using Fluent Bit as a daemon set within the EKS cluster to S3, Opensearch etc.
Logging for EKS (Fargate launch type)
Control plane logging / Node group is enabled by default by shipping logs to Cloudwatch
Application logging - you can ship logs using Fluent Bit as a daemon set within the EKS cluster to S3, Opensearch etc.
Analysing logs
You can use Cloudwatch Logs insight to review and analyse logs stored in CloudWatch, run queries to filter out logs based on your query parameter, and dive deep into your logs easily.
Pushing Custom Metrics to CloudWatch
You can embed custom metrics along side detailed log events as a single API call which is sent async to CloudWatch using the Cloudwatch embedded metric format (EMF) available through the AWS CloudWatch library.
Cloudwatch OpenTelemetry Collector: Once CloudWatch agent is in installed in your servers or our containers, you can ship logs provided by the OpenTelemetry APIs and SDKs to CloudWatch via your CloudWatch agent.

Traces
AWS X-Ray - a distrubuted tracing solution from AWS.
A trace is identified using a trace ID, which tracks a part of a request as it goes through the various layers of the application. A trace is also made up of segments which are generated by single requests. You also have sub-segments which provides granular timing details on each call made by an request, and how log they take, and each downstream call the request makes while being processed.
Implementing tracing
Infrastructure level
- AWS X-Ray is built into Lambda and API Gateway
- The X-Ray daemon can be installed in EC2 and Docker containers which collects segments data and invokes the X-Ray api to ship your tracing data to AWS X-Ray service
Application level
AWS X-Ray SDK is available in diferent languages. With it you can:
- track incomming requests to your application (like an interceptor)
- wrap it around your client handlers used to intergreate with other services
- use an HTTP client to make and track calls
Tracing with AWS Distro for OpenTelemetry (ADOT)
You can instrument your application with AWS distro for OpenTelemetry. You can instrument your functions (lamba layer), containers (as a side car or daemon set) or instances (agents installed in the instance). You can then ship these traces to any of the following tools; AWS X-Ray, AppDynamics, Grafana, HoneyComb, Lightstep, NewRelic. AWS X-Ray 
Digital experience monitoring
This involves 4 key areas related to cutomer experice;
- Observe (See what custemers see)
- Inspect (Debug issues)
- Respond (Reduce MTTR)
- Validate (Reduce risks for new features.)
Tools for digital experience monitoring
- Cloudwatch Synthetics - monitor applications 24/7 using modular lightweight canary scripts. This helps to ensure your API endpoints are always available and that your website is also always loading a page correctly. This provisions a lambda function to create a headless chrome browser to test the actions within the canary script. it can also capture screenshots and store in S3. You can also integrate with Amazon Event bridge to trigger actions depending on if a canary test is sucessful or if it failed.

- Cloudwatch RUM - Real user monitoring helps to get insights into actual enduser experience. You will be given a script which will be inserted to the head section of all your html pages, this will help track the naviagtion activity of your users, potential javascript / http errors and give you insight into the exeprience of your users. It also gives you details of the page loads and load speed for your pages.

- Cloudwatch evidently - Safely launch new features and validates web application choices by conducting online experiments. You can instrument your application using Cloudwatch RUM, and then using Cloudwatch evidently to decide if your experiment should be terminated depending on the results of the experiment.

Insights
Cloudwatch Insights enables you to combine your results from logs, traces and metrics.
You have the following options;
- Container insights
- Lambda insights
- Contributor insights
- Application insights
- Metric insights (in Preview)
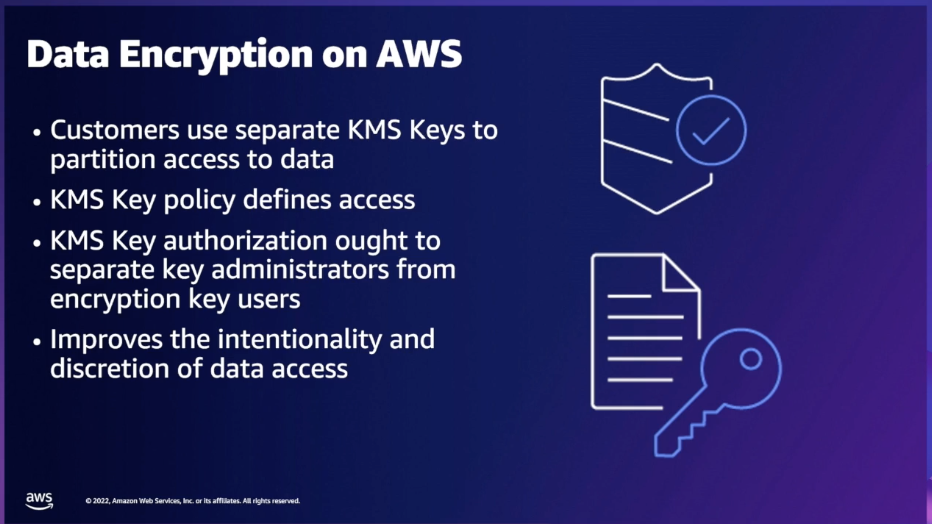
Data Protection in AWS
Overview of KMS key use for data encryption in AWS and access restriction using Key policies.
AWS Macie helps to scan for personal identifiable information and materials in your S3 buckets using Machine learning, you can also create your own data types. 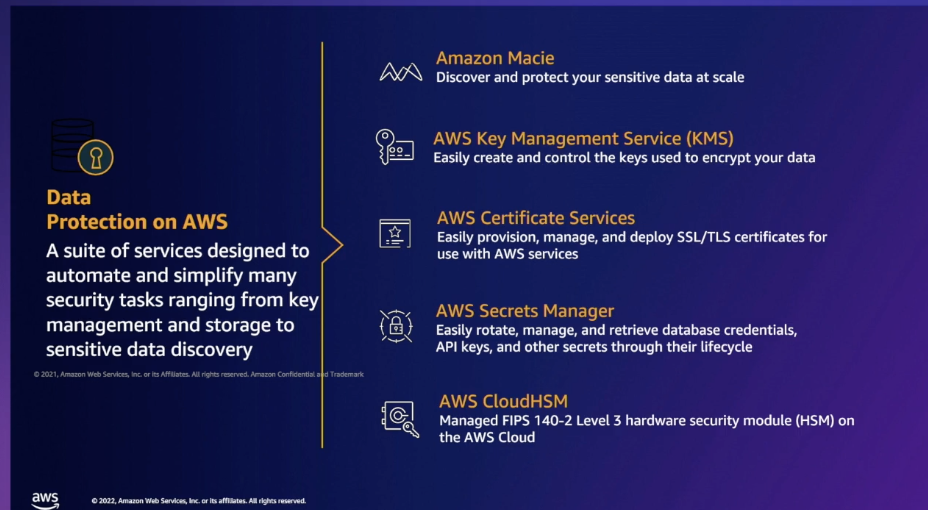
The foundational level for data protection implementation in AWS involves setting up encryption for all data at rest, providing secure policies with least privledges for access to KMS keys, enabling encryption for all data in trasit and managing all TLS certificates using AWS Certificate manager.

The intermediate level for data protection implementation in AWS involves enforcing the use of KMS and AWS Certificate manager acorss all accounts within your AWS organization, enabling the use S3 keys for cost optimization, Replicating KMS keys and secrets across regions for disaster recovery, and enabling the use of Amazon Macie to review data store in S3 and check for compliance with existing policies.

The advanced level for data protection implementation in AWS involves the use of AWS Secrets to protect database credentials, creating AWS Private CA to provide secure certificates for Kubernetes pods and certificates at scale, leveraging integrations and technology to improve cloud security and creating a robust DevSecOps pipeline with data protection and privacy.

Design patterns to increase the availability of your online applications
When using Route 53 fail over option, if the active endpoint goes down, Route53 will detect this after the endpoint has failed healthcheck and then start routing traffic to the fail over route. This approach could impact the availability of the application. Route53 carries out a stateful failover and it needs healthcheck to fail before it can switch over to the secondary endpoint.
We can make use of CloudFront Origin fail-over as shown in the diagram below to increase the availability of our applications and improve the time for failover if our primary origin becomes unavailable.

CloudFront Origin Setup
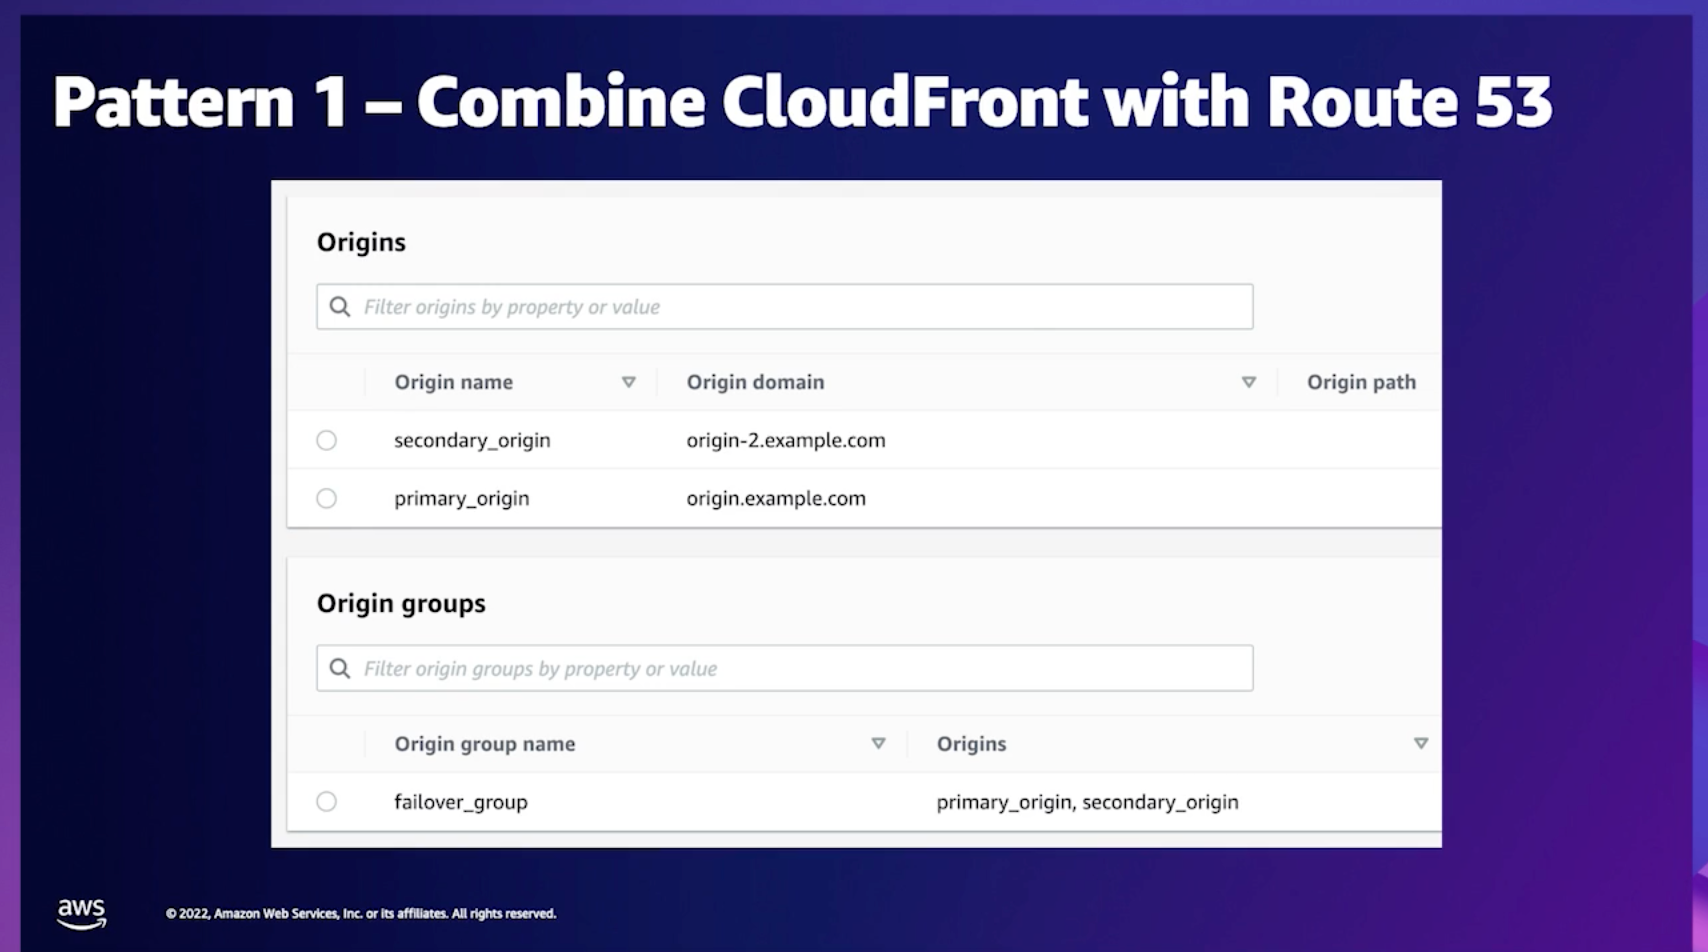
Cloudfront fail-over is stateless, combining Cloudfront with Route53 is an excellent choice to guarantee immediate failover with multi-origin setup and then increase availability.
Dynamic origin routing
The case study below shows a design pattern using Lambda@Edge to dynamically route traffic between different endpoints. This use case is applicable when traffic has to be routed based on custom data and metrics.

Any update to the routing logic has to be made diretly to the Lambda@Edge code as shown below;
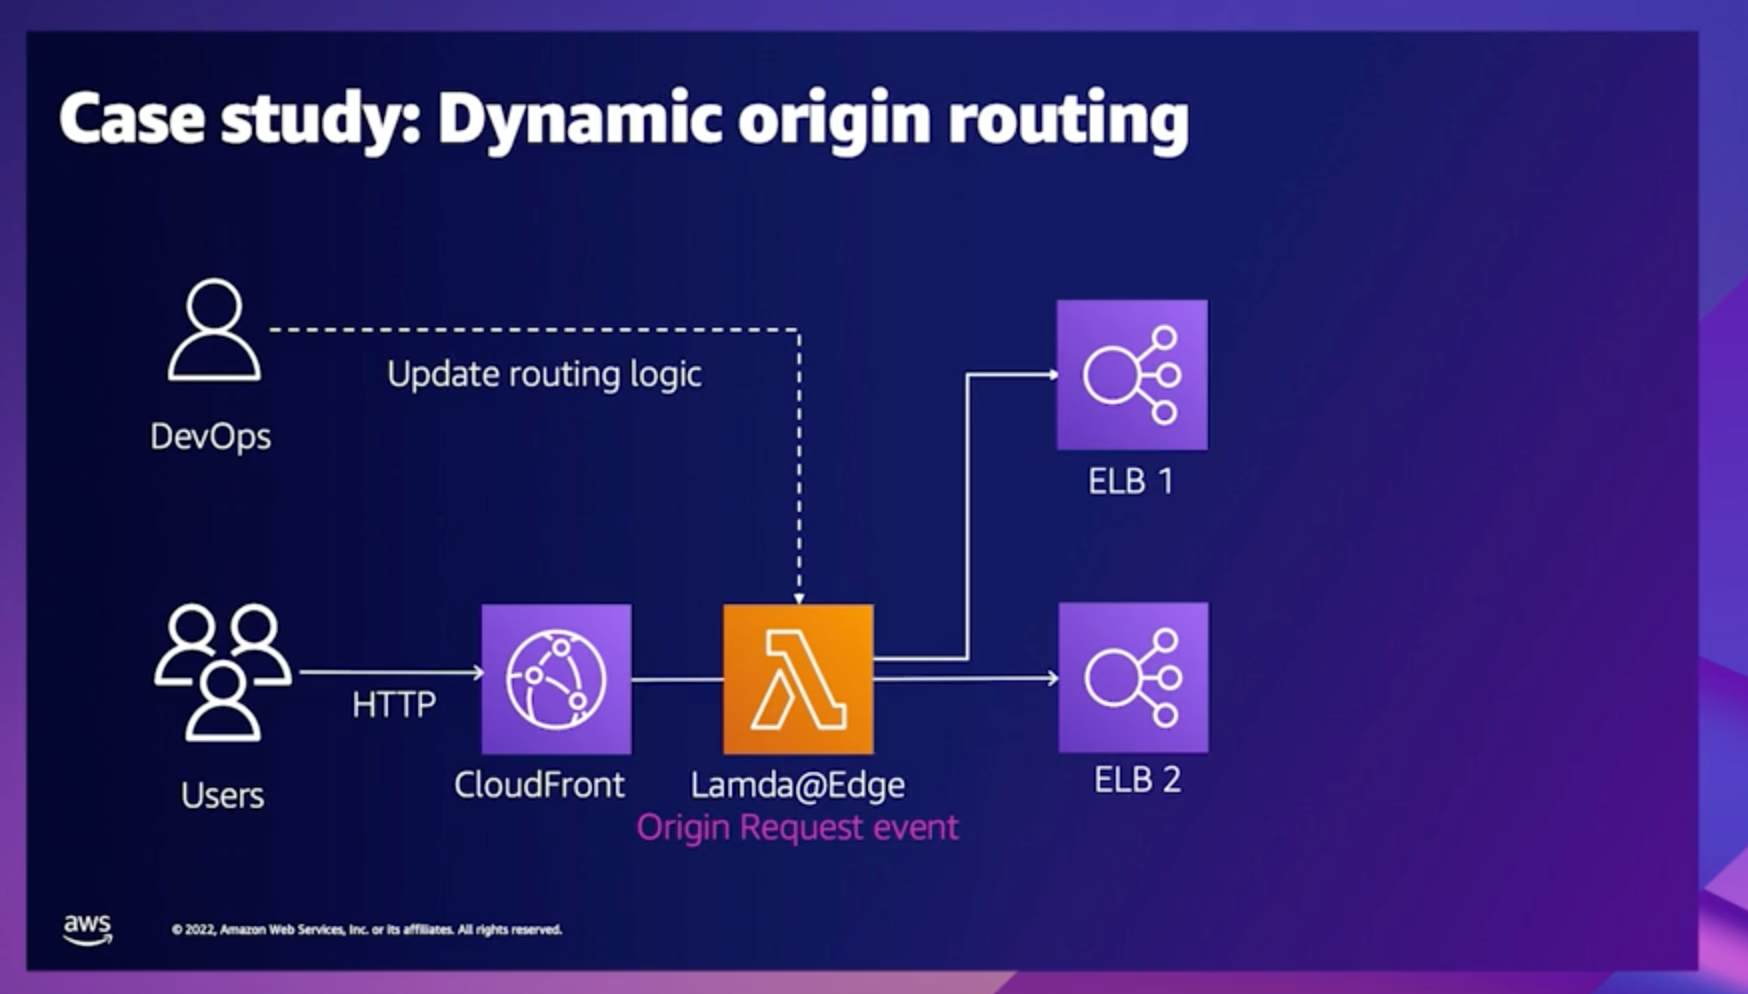
The design above is efficient, but could be problematic if you have to update the routing logic, as you will have to make a code change to the Lambda@Edge script. When the script for Lambda@Edge is updated, the change has to be propagated to all AWS edge locations world wide, this will cause a delayed implementation of the new routing logic and can be an issue if an update needs to be made immediately.
Better design choice

Using the design patter above, the routing logic and any dynamic information can be stored in dynamoDB. So there will be no need to change the underlying code for Lambda@Edge thereby increasing availability and making end point updates transparent to the end users.
Serverless compute options for origin routing
There are two serverless options available for user customization at origin level in AWS.
- CloudFront functions enables the use of lightweight functions in JavaScript to manipulate Http request and response data amongst other feature.
- Lambda@Edge enables developers to write code closer to users with the ability to customize user content and easily carry out complex routing functions.
The image below provides a comparison between CloudFront functions and Lambda@Edge. 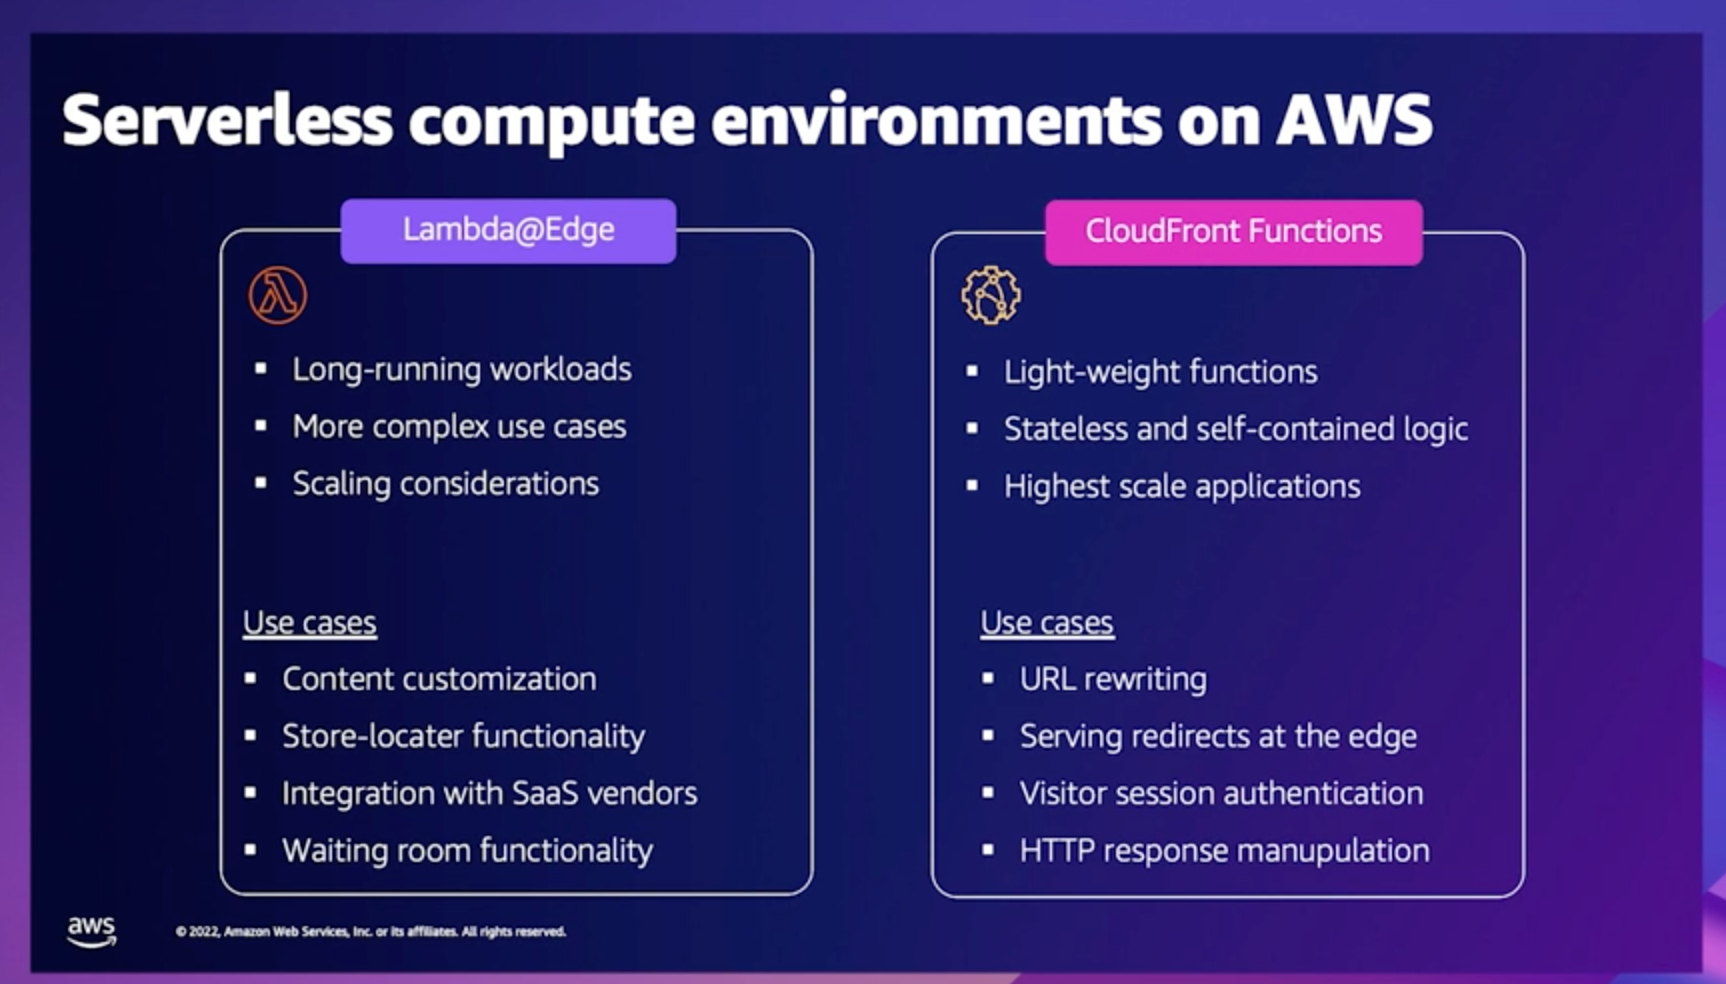
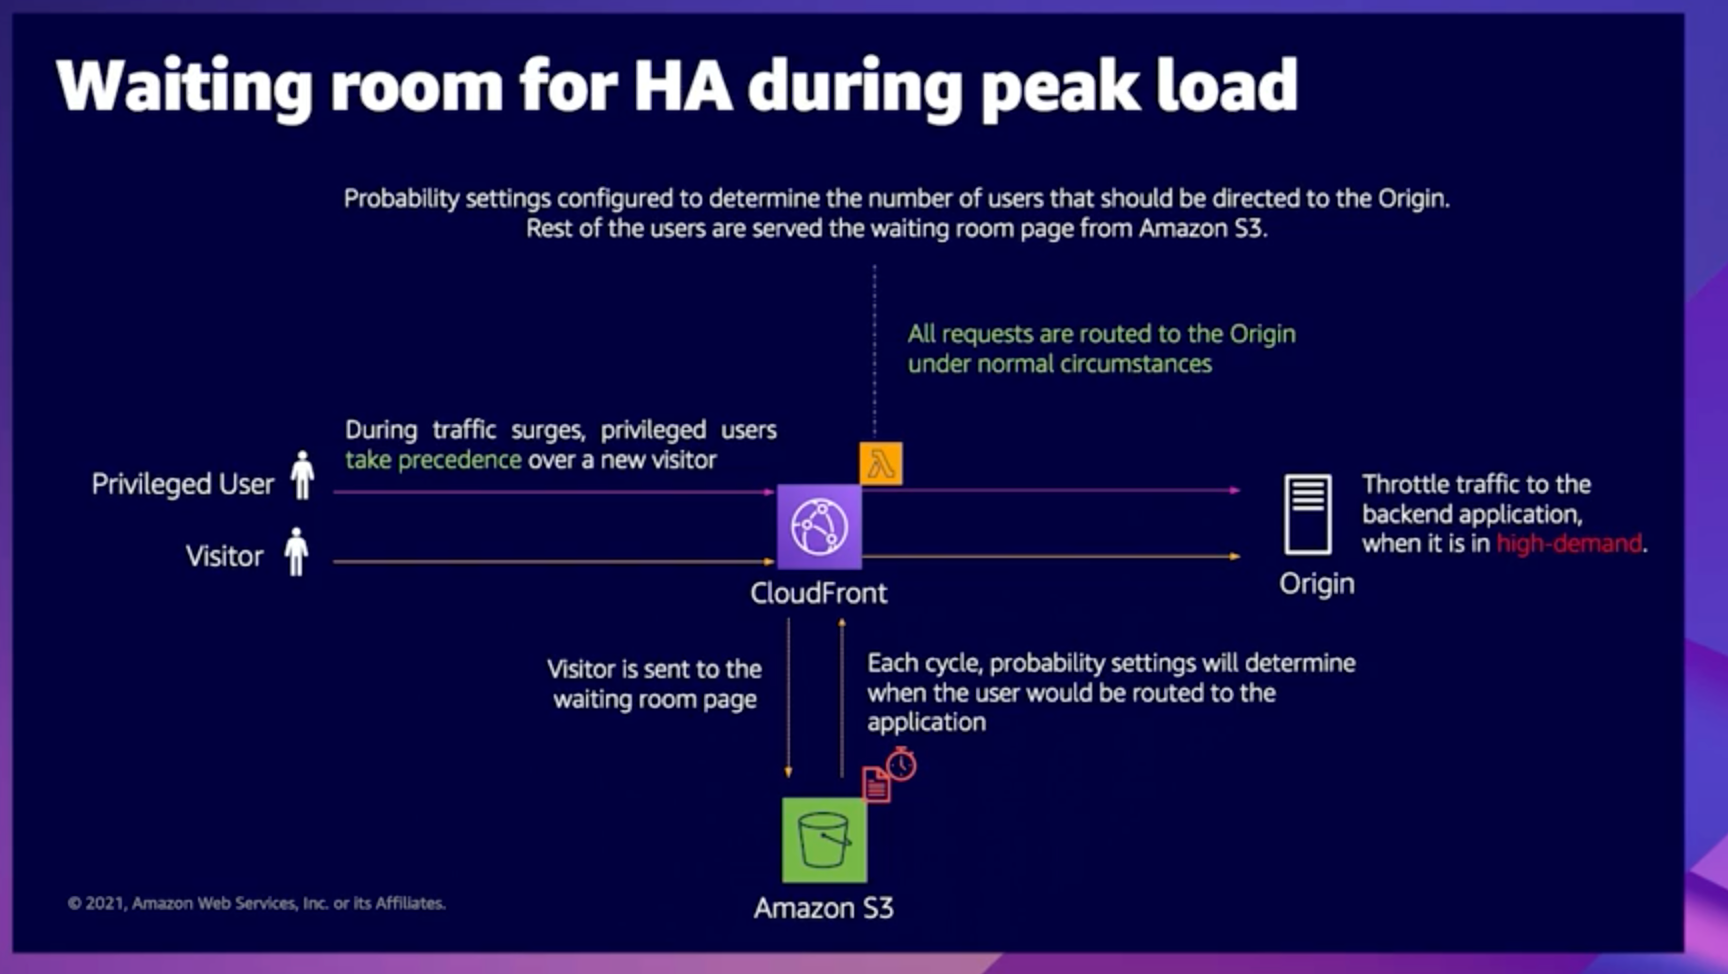
Virtual Waiting Room on AWS for High Availability
The AWS Virtual waiting Room can help to manage traffic to your website during high peak periods. The virtual waiting room provides a buffer for your website during high traffic periods to prevent resource exhaustion and throtting and create a better user experience. The AWS Virtual Waiting Room solution is open source and available today at no additional cost.