---
title: Olympic Medal Rivalry
teaser: 'Answering questions using the medal results of the 2012 Olympic Games.
'
tags: fun,data,new bamboo,web
author: Makoto Inoue
published_on: 2012-06-22
---
_This post was originally published on the New Bamboo blog, before [New Bamboo
joined thoughtbot in London][new-bamboo-thoughtbot]._
---
# Olympic Medal Rivalry
[]
(
http://www.flickr.com/photos/misskprimary/1037241095/
"Flags by misskprimary, on Flickr"
)
## Introduction
Whether you bought many game tickets or are ready to pack your clothes to fly
away from chaotic London, there is one thing you can not ignore during the
Olympic game period: the medal counts race among countries. The IOC states that
the competition is among individuals, not countries, but that's what most people
get excited or emotional about.
I analysed the past Olympic data from various angles and created a few data
visualisation apps. You can play with the apps so that you can find answers to
the following questions everybody is curious about:
- How is medal rank going to change throughout the game?
- How does the hosting nation perform?
- What sports does my country do well and which countries are our rivals?
## How is medal rank going to change throughout the game?
To answer the question, I collected the last three olympic final results
(Beijing, Athens, and Sydney) from [database olympics] and rearranged the medal
wining dates to fit into the [London Olympics game schedule] of top 12 countries
that won medals (gold, as well as silver and bronze) throughout the three
Olympics.
The graph shows the daily count of medals ("daily") as well as the accumulated
total ("total"). I also calculated the average counts among the three Olympics
("Average").
The "daily" graph tells you certain trends of medal winning trend for each
country. Some countries win medals consistently, while others stagnate in the
middle or come in at the very end. The 3 trends I found were:
- Mountain (high in the middle) = USA, China
- Cliff (low in the middle) = Australia, UK, Italy, France, and Ukraine
- Last spurt = Russia, Cuba
The "total" graph of 2008 tells you the dead heat battle between USA and China
at the last Olympic games, but it also shows that the rivalry between the two
only happened in the last Olympic games where China was the host nation. In
"average" (see below), the USA dominates the medal race, but Russia comes back
in at the end.
My answer to the first question is
> Watch out for Russia. They will climb up the ladder in the final few days.
## How does the hosting nation perform?
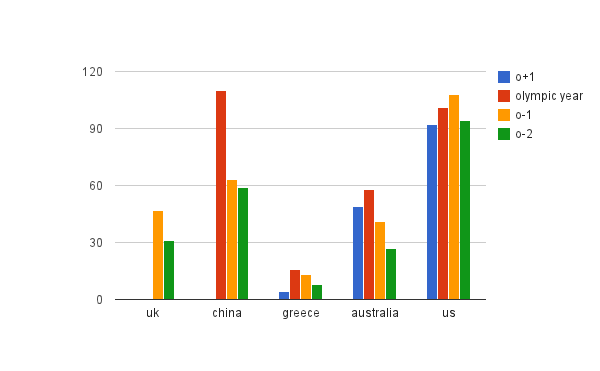
To compare past hosting nations performance, I created a bar chart of medal
counts that shows the increase and decrease of medals before , at, and after
the Olympics of the hosting nations (UK, China, Greece, Australia, and USA). For
example, China's "olympic year" is 2008, "o+1" is 2012, "o-1" is 2004, while
Australia's "olympic year" is 2004, "o+1" is 2008, and "o-1" is 2000.
Why did I lay out like these? London was selected as the host city 7 years ago
in 2005. My hypothesis is that the Olympics that was held 8 years prior to the
hosting country's Olympics reflects the usual performance of the nation, then
the country's medal performance improves because government spend more budget
for sports, reaches its highest during their Olympic year, then declines after
that. The graph shows the trend clearly except US at Atlanta.
- [Host countries medal counts(Google Doc)][medal-count-doc]
It is obvious that hosting country perform well, but how much does UK perform,
and how less China will perform this time? The following chart shows where each
country's "o-2" is based as 1 and shows their growth towards their Olympic year.

The above chart shows that Olympic year performs 170% better than the previous
previous Olympic, then goes down to 110% in the following Olympic. The sample
figures are so small, so it's far from scientific prediction, but if you apply
the ratio to UK and China, UK is going win 55 medals while China wins 65. 10
medal difference are not too apart.
Here is my answer to the second question.
> It is more likely that UK get more medals than the last Olympic. Whether UK
> can get to 3rd place or not depends on how China's medal counts drops after
> hosting Beijing.
## What sports does my country do well and which countries are our rivals?
Before you find out what sports your country do well, it's worth exploring what
kind of sports contribute to medal counts more than the others.
There are over 30 different sports in the Olympic. People's eye tends to go into
popular sports such as Swimming, Track & Field, Tennis, and Football, though
some less popular sports contribute to the medal counts race more. The following
are the donuts chart of medal counts breakdown per category. Like other graphs,
you can filter by Olympic years or category names.
And here are the top 6 most number of medal generating sport categories.
- Track&Field = 14%
- Swimming = 10%
- Wrestling = 7%
- Cycling = 6%
- Judo = 6%
- Shooting = 6%
The top two (track & field and swimming) are very popular sports, but the third
and the below (Wrestling, Cycling, Judo and Shooting) are less popular I must
say. Also it's worth noting that all the ball games; Baseball(3), Softball (3),
Water Polo(6), Basketball(6), Handball(6), Field Hockey(6), Football(6),
VolleyBall(12), Table Tennis(12), Badminton(15), Tennis(12) combined (87) are
even less than 10 % of the total medal counts (952).
You can scope this chart by Olympic years as well as each country, and here are
dominant sports of 7 countries.
USA = Swimming(25%), Track & Field(19%), and Wrestling(7%)
RUS = Track & Field(19%), Wrestling(12%), Gymnastic(12%), and Shooting(9%)
CHN = Gymnastic(15%), Shooting(13%), Weightlifting(10%), and Diving(10%)
AUS = Swimming(33%), Cycling(13%), and Rowing(8%)
GER = Canoeing(17%), Cycling(13%), Swimming(8%), Rowing(7%), and Fencing(7%)
FRA = Cycling(15%), Swimming(12%), Fencing(11%), Judo(10%)
GBR = Cycling(23%), Track & Field(16%), and Sailing(13%)
This gives you interesting rivalry between top ranking countries. While many top
countries compete medals in Cycling (AUS, GER, FRA, and GBR) and Swimming (USA,
AUS, GER, and FRA), there are some sports where top countries are not competing
as much, such as Judo for FRA and Weightlifting, Diving, and Shooting for CHN
(Did China carefully choose the sports to invest so that they are less likely to
compete against top medal ranking countries?). To visualise each country more
clearly, I created a Chord diagram that shows relationship of countries that
shared podium in the same event.
The overall relationship of each country are rather confusing. It becomes
interesting when you filter the diagram via category you are interested in.
For GBR, the biggest rival of Cycling is AUS , that of Track & Field is RUS, and
that of Sailing is USA.
The answer to the last question depends on which country you support for. Have a
look around the app to see if you can find interesting rivalries.
## The data and Hackathon around the London's summer of sports
I used [Ruby] to scrape the data and [d3.js] (as well as [Rickshaw], time series
library on top of d3) for visualisation. I also used Guardian's [Miso project]
for one of the visualisation apps.
Data for the schedule app are at
-
-
-
-
Data for category and and rivals app are at
-
One note about "summer_results.json". This data includes all the medalists
information, and it does not represents medal counts per country as is because
it list all medalist names. For example, there are 12 gold medalists for 2008
Basketball, though it should be counted as 1. To work around, you need to
aggregate by year, country, medal, and event. This does not work in rare
occasion if one country got 2 bronze medals in a individual tournament (such as
Judo), but gives you approximate counts.
You can do a lot of interesting analysis and visualisation around Olympics and
there will be more interesting data once the event starts.
We are organising a "Hackathon" ("Hack" + "Marathon") where graphic designers,
programmers, journalists, sports enthusiasts, and anyone with cool ideas and
data gather in one place during a weekend to create something cool, fun and
useful around the theme of London and Sports. If you are interested, please
check out MMXII Hack.

[d3.js]: http://d3js.org
[database olympics]: http://www.databaseolympics.com
[London Olympics game schedule]: http://www.bbc.co.uk/sport/olympics/2012/schedule-results
[medal-count-doc]: https://docs.google.com/spreadsheet/ccc?key=0AiFA8nA5C9rhdFFmY3lDR2VBQmlwUHpoVzhJNHFIdEE
[Miso project]: http://misoproject.com
[new-bamboo-thoughtbot]: https://thoughtbot.com/blog/new-bamboo-joins-thoughtbot-in-london
[Rickshaw]: http://code.shutterstock.com/rickshaw/
[Ruby]: http://www.ruby-lang.org